
Updated: June 4th, 2020
Introduction
Part 2 was about transitioning to Go. This post contains a demo of a Docker-based API workflow inspired by the Ardan Labs service example. After the demo I’ll end with how to debug and profile the API.
We focus on:
Requirements
Demo
Getting Started
Clone the project repo and checkout part3.
git clone https://github.com/ivorscott/go-delve-reload
cd go-delve-reload
git checkout part3
Please review Setting Up VSCode to avoid intellisense errors in VSCode. This occurs because the project is a mono repo and the Go module directory is not the project root.
The Goal
Our goal is going from an empty database to a seeded one. We will create a database container as a background process. Then make a couple migrations, and finally seed the database before running the project.
Step 1) Copy .env.sample and rename it to .env
The contents of .env should look like this:
# ENVIRONMENT VARIABLES

API_PORT=4000
PPROF_PORT=6060
CLIENT_PORT=3000

DB_URL=postgres://postgres:postgres@db:5432/postgres?sslmode=disable

REACT_APP_BACKEND=https://localhost:4000/v1
API_WEB_FRONTEND_ADDRESS=https://localhost:3000
Step 2) Unblock port 5432 for Postgres
Kill any application that might be using the postgres port on your host machine.
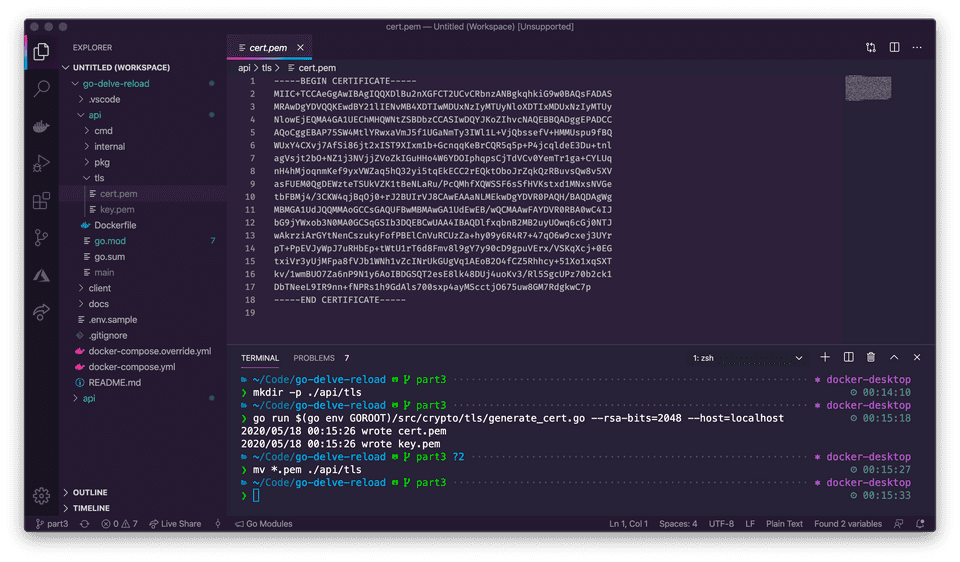
Step 3) Create self-signed certificates
mkdir -p ./api/tls
go run $(go env GOROOT)/src/crypto/tls/generate_cert.go --rsa-bits=2048 --host=localhost
mv *.pem ./api/tls
Step 4) Setup up the Postgres container
The database will run in the background with the following command:
docker-compose up -d db

Create your first migration
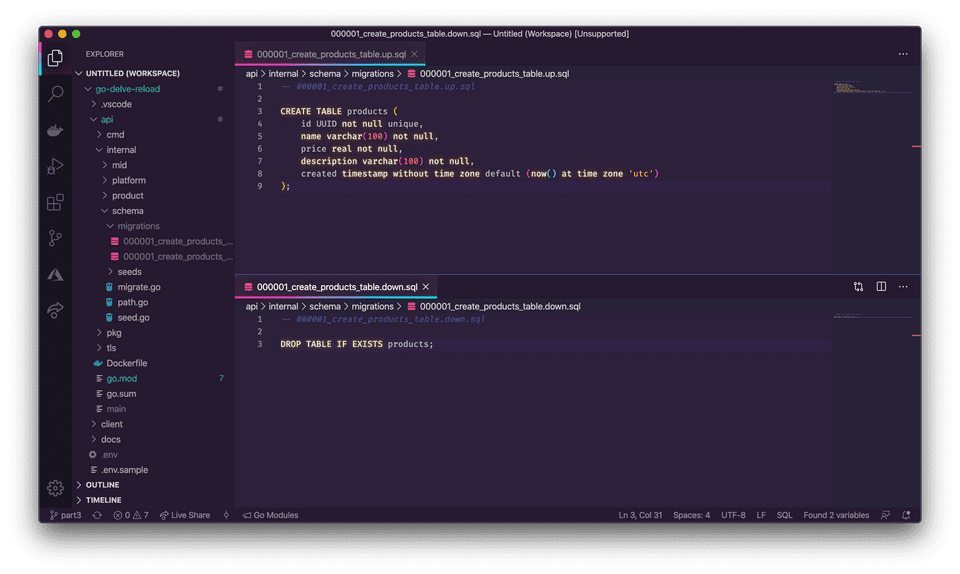
Make a migration to create a products table.
docker-compose run migration create_products_tableDatabases have a tendency to grow. We use migrations to make changes to the postgres database. Migrations are used to upgrade or downgrade the database structure. Add SQL to both up & down migrations. The down migration simply reverts the up migration if we need to.
The files are located under: ./api/internal/schema/migrations/.
Up Migration
-- 000001_create_products_table.up.sql

CREATE TABLE products (
    id UUID not null unique,
    name varchar(100) not null,
    price real not null,
    description varchar(100) not null,
    created timestamp without time zone default (now() at time zone 'utc')
);
Down Migration
-- 000001_create_products_table.down.sql

DROP TABLE IF EXISTS products;
Create a second migration
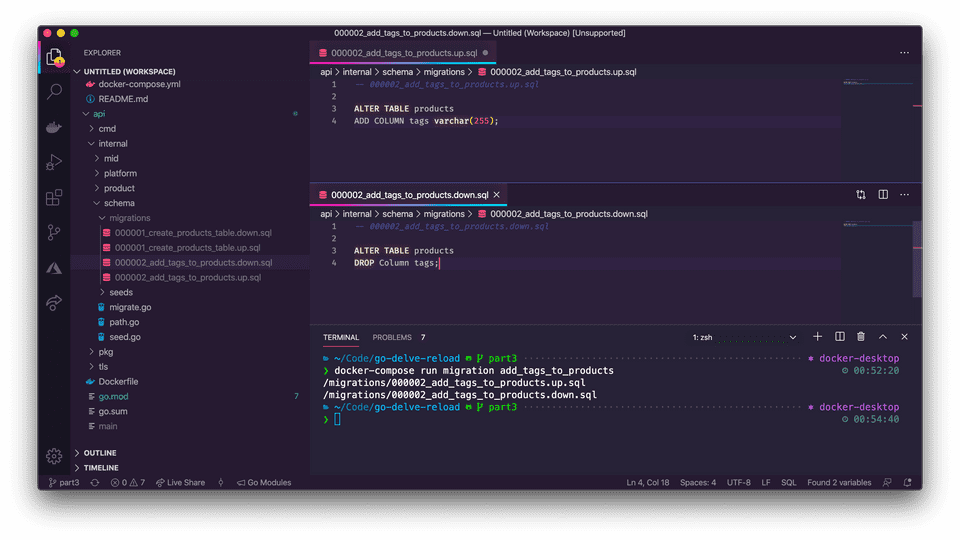
Let’s include tagged information for each product. Make another migration to add a tags Column to the products table.
docker-compose run migration add_tags_to_productsUp Migration
-- 000002_add_tags_to_products.up.sql

ALTER TABLE products
ADD COLUMN tags varchar(255);
Down Migration
-- 000002_add_tags_to_products.down.sql

ALTER TABLE products
DROP Column tags;
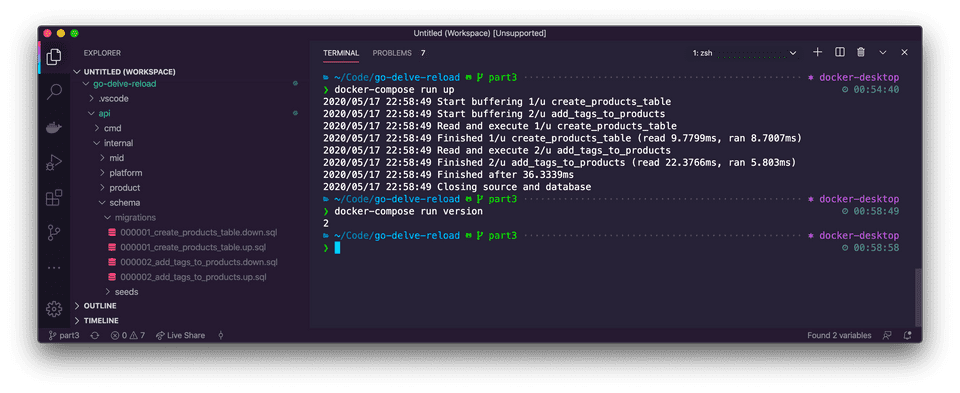
Cool, we have 2 migrations but we haven’t used them yet. Migrate the database up to the latest migration.
docker-compose run up # you can migrate down with "docker-compose run down"Now if we checked the selected migration version, it should render 2, the number of total migrations.
docker-compose run version
Seeding the database
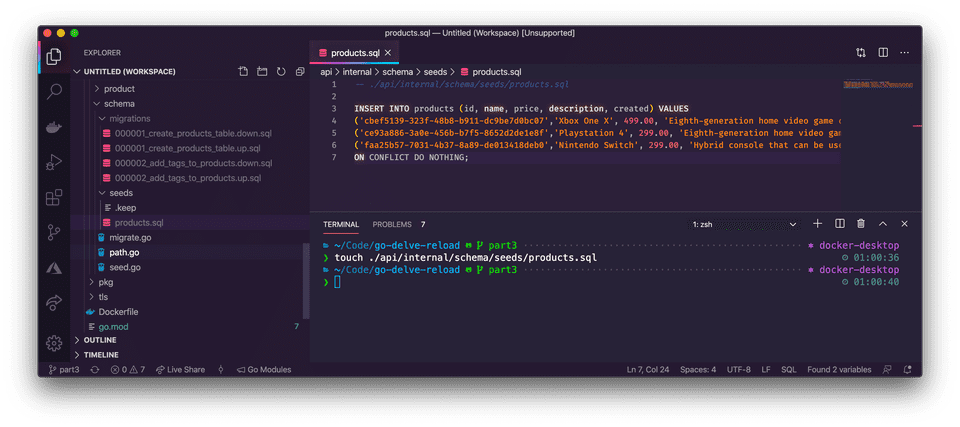
The database is still empty. Create a seed file for the products table.
touch ./api/internal/schema/seeds/products.sqlThis adds an empty products.sql seed file to the project. Located under: ./api/internal/schema/seeds/.
Add the following SQL content. This data will be used during local development.
-- ./api/internal/schema/seeds/products.sql

INSERT INTO products (id, name, price, description, created) VALUES
('cbef5139-323f-48b8-b911-dc9be7d0bc07','Xbox One X', 499.00, 'Eighth-generation home video game console developed by Microsoft.','2019-01-01 00:00:01.000001+00'),
('ce93a886-3a0e-456b-b7f5-8652d2de1e8f','Playstation 4', 299.00, 'Eighth-generation home video game console developed by Sony Interactive Entertainment.','2019-01-01 00:00:01.000001+00'),
('faa25b57-7031-4b37-8a89-de013418deb0','Nintendo Switch', 299.00, 'Hybrid console that can be used as a stationary and portable device developed by Nintendo.','2019-01-01 00:00:01.000001+00')
ON CONFLICT DO NOTHING;
Finally, apply the seed data to the database.
docker-compose exec db psql postgres postgres -f /seed/products.sql
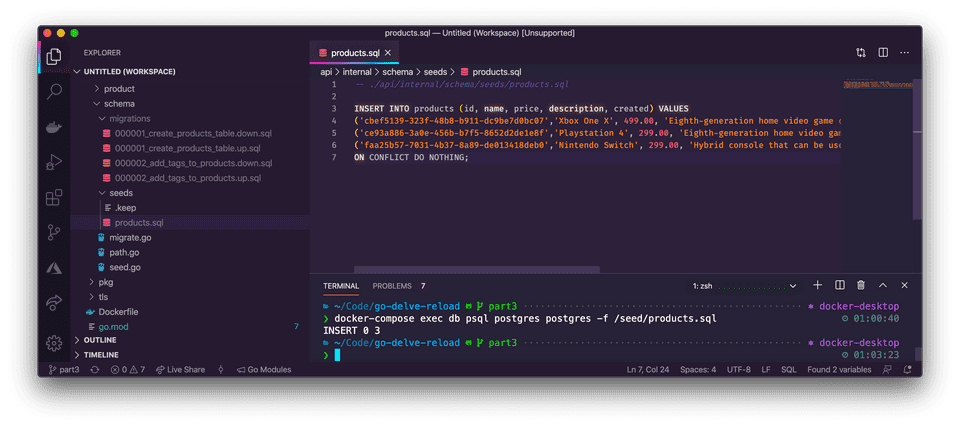
Great! Now the database is ready. The output should be INSERT 0 3. The 3 represents the 3 rows inserted.
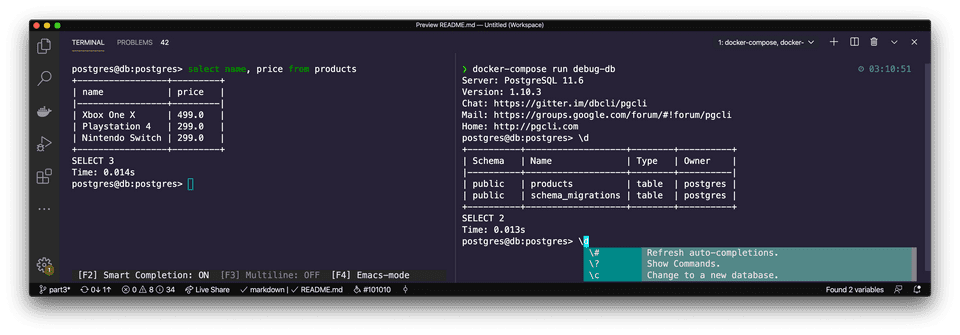
Now, let’s enter the database and examine its state.
docker-compose run debug-db
Step 5) Run the frontend and backend
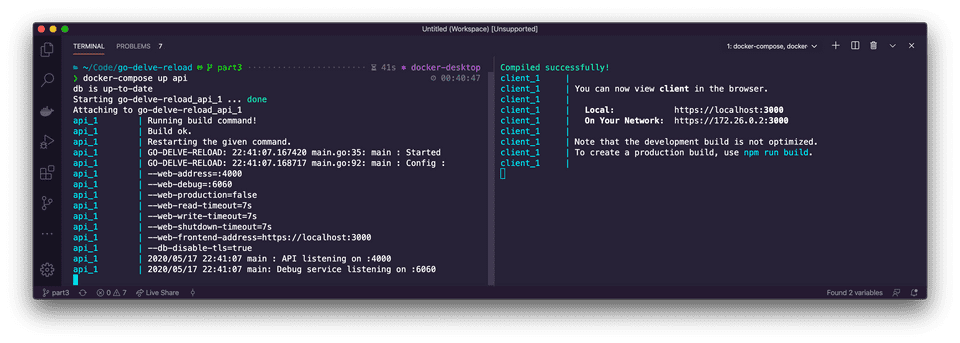
If you run the following commands in separate windows you can preserve the initial API output (create-react-app clears the terminal otherwise)
docker-compose up api
docker-compose up client
Or run in one command.
docker-compose up api clientNavigate to the API in the browser at: https://localhost:4000/v1/products.
Note: To replicate the production environment as much as possible locally, we use self-signed certificates. In your browser, you may see a warning and need to click a link to proceed to the requested page. This is common when using self-signed certificates.
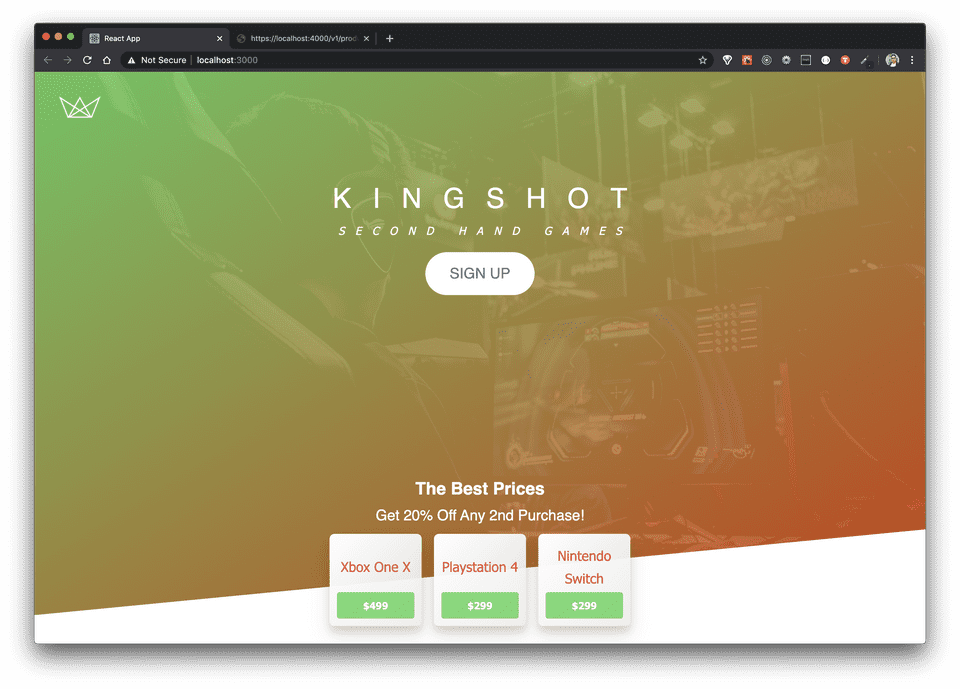
Then navigate to the client app at: https://localhost:3000 in a separate tab.
Step 6) Run unit and integration tests
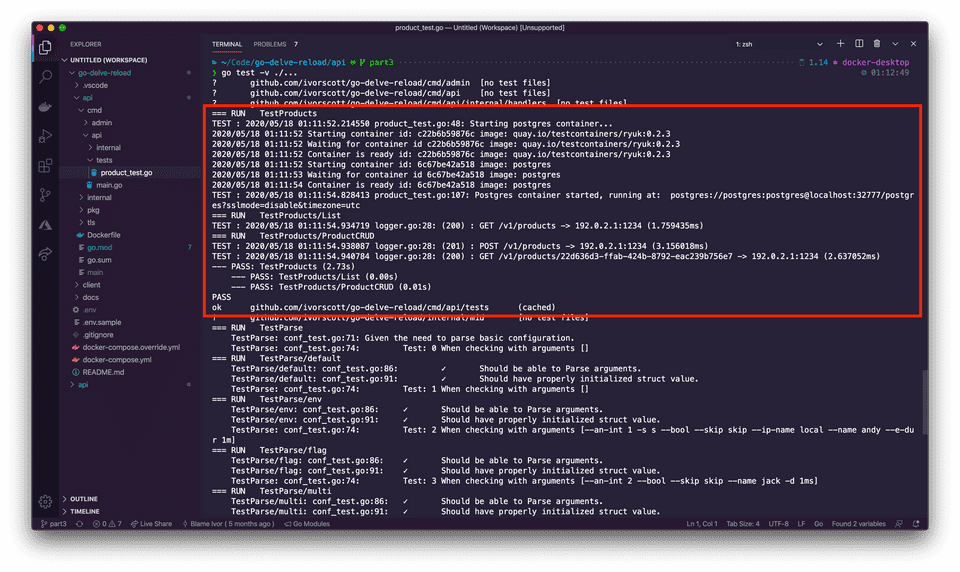
Integration tests run in addition to unit tests. During integration tests, a temporary Docker container is programmatically created for Postgres, then automatically destroyed after tests run. Under the hood the integration tests make use of the testcontainers-go.
cd api
go test -v ./...
Optional Step) Idiomatic Go development
Containerizing the Go API is optional, so you can work with the API in an idiomatic fashion. This also means you can opt-out of live reloading. When running the API normally use command line flags or exported environment variables. TLS encryption for the database is enabled by default and should be disabled in development.
export API_DB_DISABLE_TLS=true
cd api
go run ./cmd/api
# or go run ./cmd/api --db-disable-tls=true
Debugging
Debugging the API with Delve is no different than in Part 1. Run the debuggable API first.
docker-compose up debug-apiIn api/cmd/api/internal/handlers open products.go and place 2 breakpoints inside the products List handler in VSCode. Click the debugger tab within the editor sidebar. Then click “Launch Remote”. The console will show when a breakpoint is created:
debug-api_1  | 2020-06-04T20:21:18Z info layer=debugger created breakpoint: &api.Breakpoint{ID:1, Name:"",
Addr:0x9ebf4a, Addrs:[]uint64{0x9ebf4a}, File:"/api/cmd/api/internal/handlers/products.go", Line:23,
FunctionName:"github.com/ivorscott/go-delve-reload/cmd/api/internal/handlers.(*Products).List", Cond:"",
Tracepoint:false, TraceReturn:false, Goroutine:false, Stacktrace:0, Variables:[]string(nil),
LoadArgs:(*api.LoadConfig)(0xc0010d8180), LoadLocals:(*api.LoadConfig)(0xc0010d81b0),
HitCount:map[string]uint64{}, TotalHitCount:0x0}
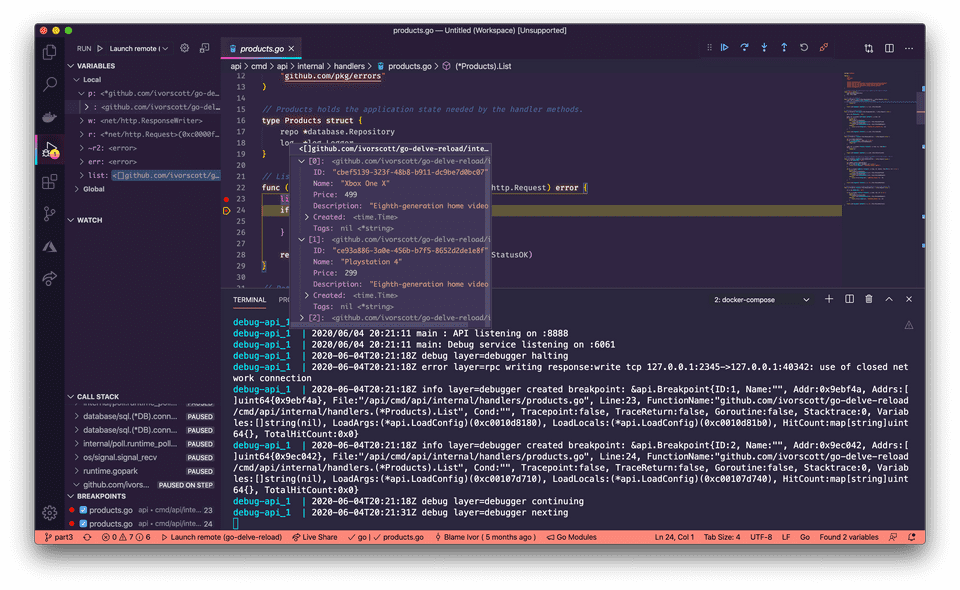
Navigate to: https://localhost:8888/v1/products to trigger the List handler. You should see the editor pause where you placed the first breakpoint. Click the step over icon (shown below) in the debugger menu to select the next breakpoint. Hover over the list variable to inspect the data.

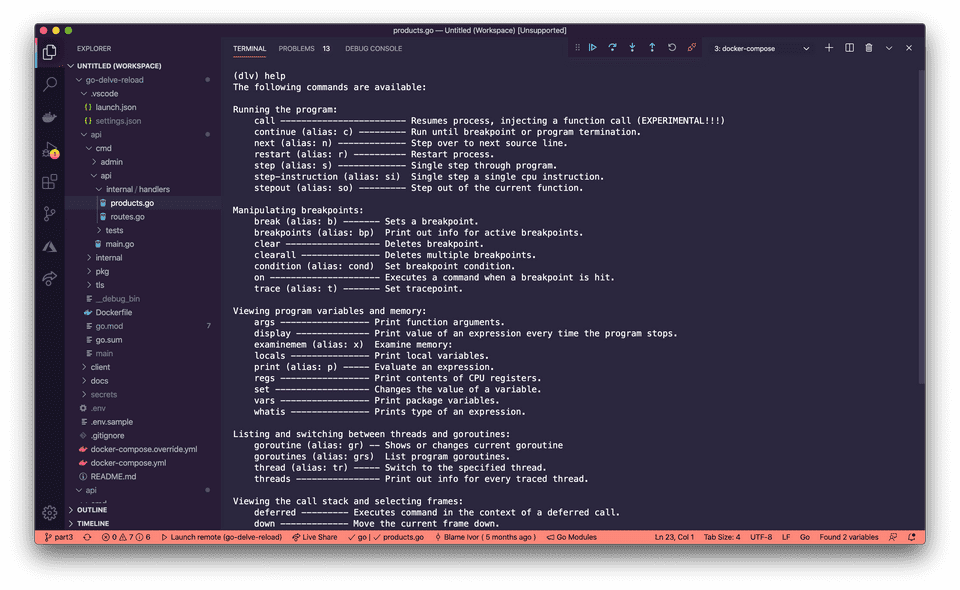
Lastly, you aren’t limited to debugging only through the editor. You can use the delve debugger directly if you know what you are doing and the debuggable API is already running:
docker-compose exec debug-api dlv connect localhost:2345
Profiling
Here’s a few predefined profiles pprof provides:
- block: stack traces that led to blocking on synchronization primitives
- goroutine: stack traces of all goroutines
- heap: sampling traces of all current goroutines
- mutex: stack traces of holders of contended mutexes
- profile: CPU profile

Using pprof to measure an API, involves importing net/http/pprof the standard HTTP interface to profiling data. Since we don’t use the import directly and just wish to use its side effects we place an underscore in front of the import. The import will register handlers under /debug/pprof/ using the DefaultServeMux. If you are not using the DefaultServeMux you need to register the handlers with the mux your are using. It’s worth noting, that these handlers should not be accessible to the public because of this we use the DefaultServerMux on a dedicated port in a separate goroutine to leverage pprof.
// api/cmd/api/main.go
go func() {
  log.Printf("main: Debug service listening on %s", cfg.Web.Debug)
  err := http.ListenAndServe(cfg.Web.Debug, nil)
  if err != nil {
    log.Printf("main: Debug service failed listening on %s", cfg.Web.Debug)
  }
}()
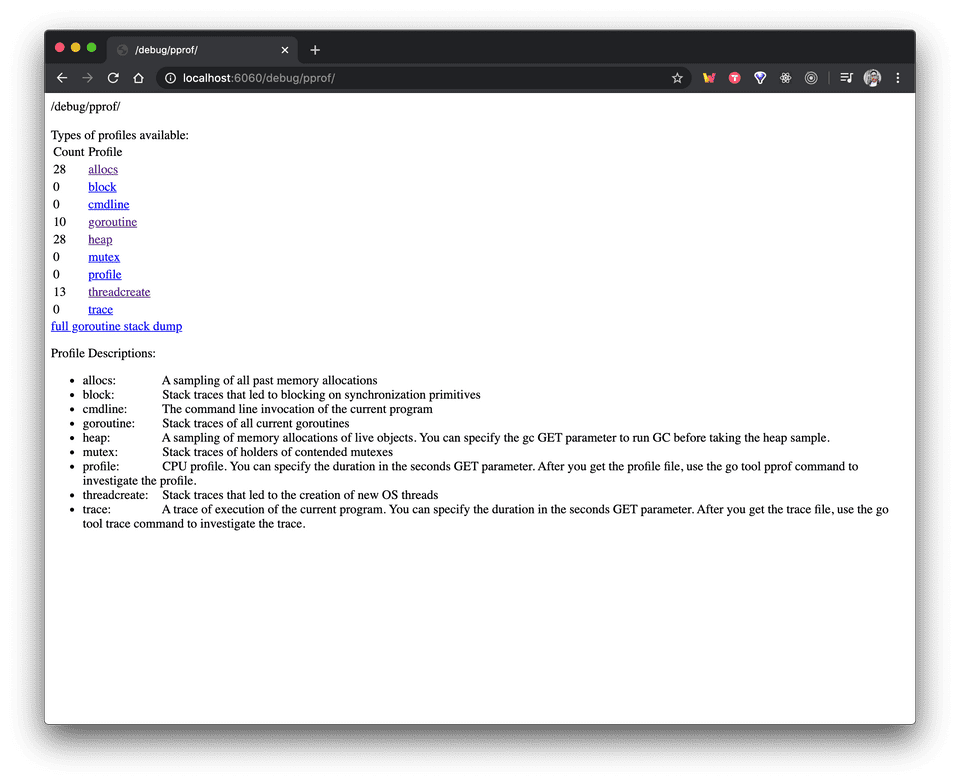
In production, remember that publicly exposing the registered handlers pprof provides is a major security risk. Therefore, we either choose not to expose the profiling server to Traefik or ensure it’s placed behind an authenticated endpoint. If we navigate to http://localhost:6060/debug/pprof/ we’ll see something like this:
Some additional utilities you may want to install are an HTTP load generator like hey and graphviz to visualize a cpu profile in a web page.
brew install hey graphvizThen in one terminal you can make 10 concurrent connections to make 2000 requests to the API.
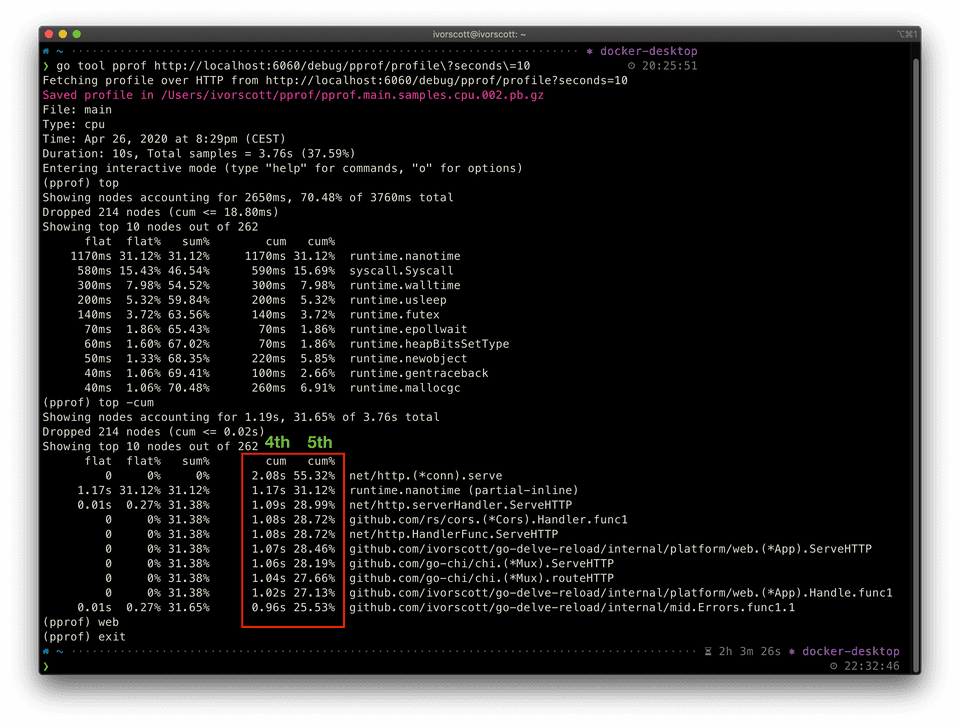
hey -c 10 -n 2000 https://localhost:4000/v1/productsWhile in another terminal, we leverage one of the registered handlers setup by pprof. In the case, we want to capture a cpu profile for a duration of 10 seconds to measure the server activity.
go tool pprof http://localhost:6060/debug/pprof/profile\?seconds\=10Afterward we can run the command top -cum (this sorts entries based on their cumulative value) to analyze the profile captured. The fourth and fifth columns indicate the cumulative amount of time and percentage a function appeared in the samples (while running or waiting for a function to return).
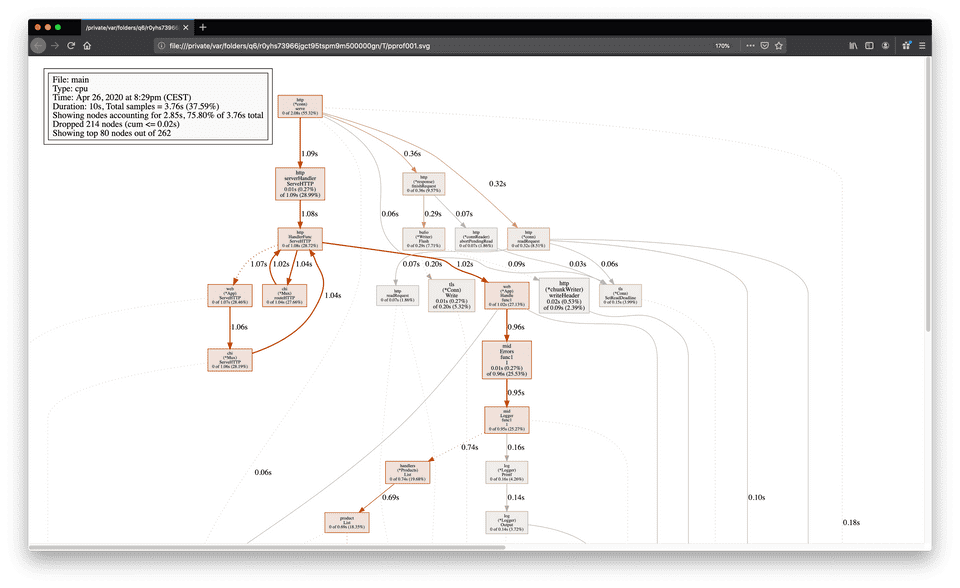
We can also view a visualization by typing web into the pprof command prompt which opens a browser window if we have graphviz installed.

Nope! I’m still wrapping my head around profiling in Go but I find pprof and continuous profiling very interesting. To learn more checkout debugging performance issues in Go programs.
Conclusion
This demonstration included seeding and migrations to handle a growing postgres database. We went from no database, to an empty one, to a seeded one, using a Docker-based workflow. Running the API in a container still uses live reload (like in Part 1). But now there’s no makefile abstraction hiding the docker-compose commands. We also discovered we can opt-out of live reload and containerizing the API all together in development taking an idiomatic Go approach with go run ./cmd/api, optionally supplying cli flags or exported environment variables.
While testing, we programmatically created a postgres container. In the background, our test database leveraged the same seeding and migration functionality we saw earlier. This enables the tests to set things up before they run. Since we used testcontainers-go any containers created are cleaned up afterwards.
Lastly, we got a glimpse at what debugging and profiling the updated API looks like. Profiling shouldn’t be a frequent task in your development workflow. Profile your Go applications when performance matters or when issues arise. Whenever you need to debug your application with delve you simply create a debuggable container instance.